Druid is a time-series database. It indexes events that occur over time, and is good at answering queries that involve aggregating values over time. In this blog post we’ll explore how Druid indexes data, examine the information it stores and see how it answers various queries. Understanding these details will help us use Druid effectively to answer important questions about our data.
Consider a website that tracks every pageview. Each pageview is captured in an event, which records the time of the pageview, the url of the visited page and a user tracking ID. We’ll use the following example set of pageview events:
{"eventId":"e1", "timestamp":"2015-03-24T14:00:00Z", "userId":"u1", "url":"http://site.com/1"}
{"eventId":"e2", "timestamp":"2015-03-24T14:00:01Z", "userId":"u2", "url":"http://site.com/1"}
{"eventId":"e3", "timestamp":"2015-03-24T14:00:02Z", "userId":"u3", "url":"http://site.com/1"}
{"eventId":"e4", "timestamp":"2015-03-24T14:00:03Z", "userId":"u1", "url":"http://site.com/2"}
{"eventId":"e5", "timestamp":"2015-03-24T14:00:04Z", "userId":"u2", "url":"http://site.com/2"}
{"eventId":"e6", "timestamp":"2015-03-24T14:00:05Z", "userId":"u1", "url":"http://site.com/3"}
{"eventId":"e7", "timestamp":"2015-03-24T15:00:00Z", "userId":"u1", "url":"http://site.com/1"}
{"eventId":"e8", "timestamp":"2015-03-24T15:00:01Z", "userId":"u4", "url":"http://site.com/1"}
{"eventId":"e9", "timestamp":"2015-03-24T15:00:02Z", "userId":"u3", "url":"http://site.com/2"}
{"eventId":"e10", "timestamp":"2015-03-24T15:00:03Z", "userId":"u4", "url":"http://site.com/2"}
{"eventId":"e11", "timestamp":"2015-03-24T16:00:00Z", "userId":"u2", "url":"http://site.com/1"}
{"eventId":"e12", "timestamp":"2015-03-24T16:00:01Z", "userId":"u4", "url":"http://site.com/1"}
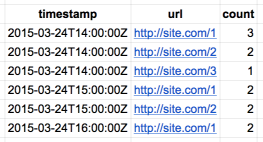
Or in a more readable form:
There are many different questions we might want to ask about this pageview data. So we load this data into some data store and then query it to answer our questions. Druid is such a data store that is good at answering questions about time-series data, such as: between Mar 1 – Apr 1 2015, what were the total number of pageviews during each hour interval? Or: what were the total number of unique visitors during each hour interval?
The key to understanding the types of questions Druid can answer and how to effectively write the queries to answer those questions is understanding how Druid aggregates, or “rolls-up” the event data that you give it. In this blog post, we’ll take a look at the different ways Druid can index these pageview events, and see how it can answer questions about them.
All of the example data, scripts, tasks and queries used in this post are available in this repo: https://github.com/zcox/druid-pageviews.
Druid can be challenging to get running. To keep it simple, we’ll use the Docker images and fig.yml from https://github.com/banno/druid-docker. This runs the Druid Broker, Coordinator, Historical and Overlord nodes along with Zookeeper, Postgres and HDFS all in separate Docker containers, and wires everything together properly.
➜  fig up -d druid
Creating druiddocker_postgres_1...
Creating druiddocker_zookeeper_1...
Creating druiddocker_druidcoordinator1_1...
Creating druiddocker_druidbroker1_1...
Creating druiddocker_hadoop_1...
Creating druiddocker_druidoverlord1_1...
Creating druiddocker_druidhistorical1_1...
Creating druiddocker_druidhistorical2_1...
Creating druiddocker_druid_1...
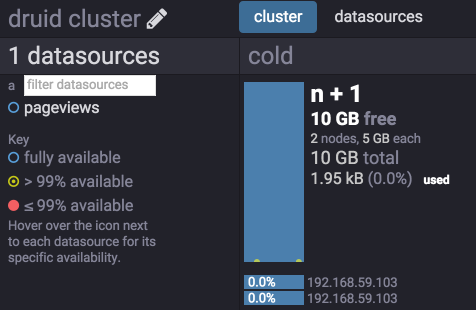
The Coordinator console is available at http://192.168.59.103:8081:
The Overlord (i.e. Indexing Service) console is available at http://192.168.59.103:8085/console.html:
One of the most basic things we might want to know about our pageview data is the total number of pageviews within each hour interval. Suppose some big-wig wants a Google Analytics style hourly pageview chart on their Executive Dashboard.
How would you calculate this from the pageview events by hand? You’d group all the events within the same hour together and just count them up. In a database, if we stored one event per row we’d do the same thing: select all rows within an overall interval, group those rows by hour, and count the rows in each hour group. If you have to perform this query many times on the same data, that’s a lot of repeated counting.
Since these are immutable events, a better approach would be to do the counting once and store the results, so the work is already done when we go to load the dashboard chart. You could think of this as a materialized view. While we could certainly write our own program to do this counting and store the results in a database, it would be easier if the database did this for us. That’s what time-series databases like Druid do!
There are lots of different ways we could pre-compute different values though. To get Druid to answer our questions effectively, we need to understand how it can pre-compute different values and then use those values to answer queries.
First we need to load the pageview data into Druid. We do this by sending an HTTP POST request to the Druid Indexing Service (i.e. Overlord node). Here is a generic script for making this request, we’ll be re-indexing our pageview data in several different ways throughout this article:
#!/bin/bash

JSON_FILE=$1
curl -X POST -H "Content-Type: application/json" -d @$JSON_FILE "http://192.168.59.103:8085/druid/indexer/v1/task"
The following JSON is an “index spec” that tells Druid the location of the data file, the size of the segment and index periods, the dimensions we want to use and metrics (or aggregations) we want Druid to create. When we send this JSON to the Overlord, it will spawn a task that indexes the data.
{
  "type": "index",
  "spec": {
    "dataSchema": {
      "dataSource": "pageviews",
      "parser": {
        "type": "string",
        "parseSpec": {
          "format": "json",
          "timestampSpec": {
            "column": "timestamp",
            "format": "auto"
          },
          "dimensionsSpec": {
            "dimensions": [],
            "dimensionExclusions": [
              "eventId",
              "userId",
              "url"
            ],
            "spatialDimensions": []
          }
        }
      },
      "metricsSpec": [
        {
          "type": "count",
          "name": "count"
        }
      ],
      "granularitySpec": {
        "type": "uniform",
        "segmentGranularity": "DAY",
        "queryGranularity": "HOUR",
        "intervals": [
          "2015-03-01/2015-04-01"
        ]
      }
    },
    "ioConfig": {
      "type": "index",
      "firehose": {
        "type": "local",
        "baseDir": "/Users/zcox/code/druid-pageviews",
        "filter": "events.json"
      }
    },
    "tuningConfig": {
      "type": "index",
      "targetPartitionSize": -1,
      "rowFlushBoundary": 0,
      "numShards": 1
    }
  }
}
When Druid indexes the events, it will group all of them with timestamps in the same index period and that have the same dimension values, then aggregate each group of events together into a single “row”. In the above JSON, we’ve told Druid to group events within the same hour together (by setting queryGranularity to HOUR) and to just record the number of events in the group (i.e. the count in the metricsSpec) in the row. Note that we have not used any dimensions at this point; we’ll get more into those later. So all Druid will do is count the number of events within each hour. Pretty simple.
Submit the index task like this:
➜  ./ingest.sh task1.json
{"task":"index_pageviews_2015-04-03T02:16:51.471Z"}
The Overlord console shows the running index task:
This task completes in just a few seconds.
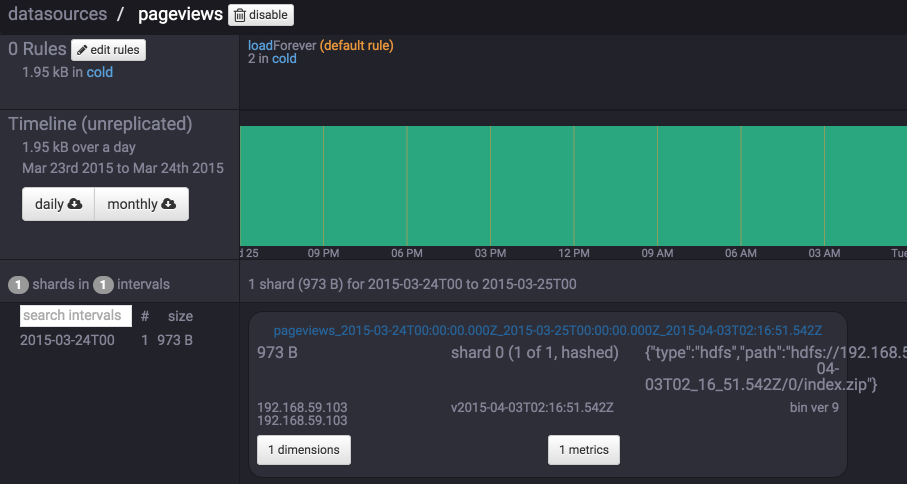
Then the Coordinator console shows the new pageviews data source that the index task created, along with the new segment in that datasource:
In the JSON above, we set segmentGranularity to DAY. Druid will combine all of the rows in the index periods into one big file called a segment file. Each segment file will contain one day’s worth of rows. Remember that a row is the aggregate of all of the events within the same index period with the same dimension values. Right now, each row is just the number of events in each hour period.
Queries are also sent to Druid in HTTP POST requests:
#!/bin/bash

JSON_FILE=$1
curl -X POST -H "Content-Type: application/json" -d @$JSON_FILE "http://192.168.59.103:8082/druid/v2/?pretty"
Before actually answering our question (total pageviews per hour) first let’s see what Druid actually computed. Here is a select query that we can send to Druid (select.json):
{
  "queryType": "select",
  "dataSource": "pageviews",
  "dimensions": [],
  "metrics": [],
  "intervals": [
    "2015-03-01/2015-04-01"
  ],
  "granularity": "all",
  "pagingSpec": {
    "pagingIdentifiers": {},
    "threshold": 100
  }
}
The select query returns the actual data Druid computed and stored in each row within its segments. The events array in the JSON below contains all of the rows (not sure why it’s called events and not rows…):
[ {
  "timestamp" : "2015-03-24T14:00:00.000Z",
  "result" : {
    "pagingIdentifiers" : {
      "pageviews_2015-03-24T00:00:00.000Z_2015-03-25T00:00:00.000Z_2015-04-03T02:16:51.542Z" : 2
    },
    "events" : [ {
      "segmentId" : "pageviews_2015-03-24T00:00:00.000Z_2015-03-25T00:00:00.000Z_2015-04-03T02:16:51.542Z",
      "offset" : 0,
      "event" : {
        "timestamp" : "2015-03-24T14:00:00.000Z",
        "count" : 6.0
      }
    }, {
      "segmentId" : "pageviews_2015-03-24T00:00:00.000Z_2015-03-25T00:00:00.000Z_2015-04-03T02:16:51.542Z",
      "offset" : 1,
      "event" : {
        "timestamp" : "2015-03-24T15:00:00.000Z",
        "count" : 4.0
      }
    }, {
      "segmentId" : "pageviews_2015-03-24T00:00:00.000Z_2015-03-25T00:00:00.000Z_2015-04-03T02:16:51.542Z",
      "offset" : 2,
      "event" : {
        "timestamp" : "2015-03-24T16:00:00.000Z",
        "count" : 2.0
      }
    } ]
  }
} ]
You can see that there is one row for each hour of data, and within each row is the count of events that occurred during that hour. Note that the timestamp for each row is at the start of the hour interval.
Another way to look at these rows:
You can go back and look at the original pageview events to see that Druid counted them correctly.
Now let’s use a timeseries query to find out the total number of pageview events per hour (pageviews.json):
{
  "queryType": "timeseries",
  "dataSource": "pageviews",
  "intervals": [
    "2015-03-01/2015-04-01"
  ],
  "granularity": "hour",
  "aggregations": [
    {
      "type": "longSum",
      "fieldName": "count",
      "name": "pageviews"
    }
  ]
}
You can read this query as saying “For each hour within the interval 2015-03-01/2015-04-01, sum the count metric of rows in that hour and return it in a field named pageviews.”
This query returns:
[ {
  "timestamp" : "2015-03-24T14:00:00.000Z",
  "result" : {
    "pageviews" : 6
  }
}, {
  "timestamp" : "2015-03-24T15:00:00.000Z",
  "result" : {
    "pageviews" : 4
  }
}, {
  "timestamp" : "2015-03-24T16:00:00.000Z",
  "result" : {
    "pageviews" : 2
  }
} ]
Pretty simple! Druid already had those counts stored in each row, so it basically just returned them to us and didn’t need to do anything else. Compare this to storing the raw pageview events in a relational database, one event per row; to answer this query, the DB would have to scan over all of those rows and count them up at query time. But Druid did that counting (i.e. aggregating) at indexing time, so that it has less work to do at query time.
So we’ve seen just about the simplest possible thing Druid will do: aggregate together events within the same hour and store the count of events. It’s cool and all, but kinda limits the questions we can answer.
What if we want to know the number of pageviews per hour for a specific url? Given the way we’ve told Druid to index our pageview events, it cannot answer that question. Recall that Druid will aggregate all events within the same index period that have the same dimension values. Dimensions are a way to “chop up” the data stored in Druid. We need to tell Druid to use url as a dimension so it will count pageviews per url. To do this, we use the same index task JSON as before, just with a different dimensionsSpec that includes url as a dimension:
          "dimensionsSpec": {
            "dimensions": [
              "url"
            ],
            "dimensionExclusions": [
              "eventId",
              "userId"
            ],
            "spatialDimensions": []
          }
We tell Druid to index these pageview events again, using this new index spec:
➜  ./ingest.sh task2.json
{"task":"index_pageviews_2015-04-03T02:36:45.419Z"}
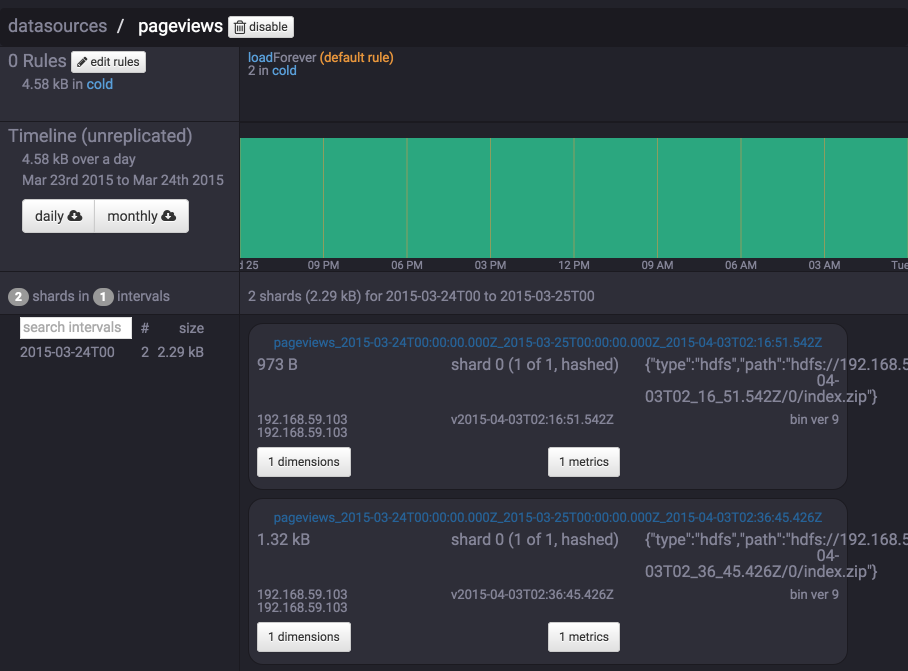
When Druid is done indexing, now the Coordinator console shows two versions of this segment:
Druid will actually use the newest version of the segment to answer queries. This is very convenient, as the same events can be re-indexed whenever you want. Also note that the size of the segment increased from 973B to 1.32kB – the segment now has more rows, and thus more data to store.
The select query now shows that Druid grouped the events by hour and url, then aggregated each group together into a count:
[ {
  "timestamp" : "2015-03-24T14:00:00.000Z",
  "result" : {
    "pagingIdentifiers" : {
      "pageviews_2015-03-24T00:00:00.000Z_2015-03-25T00:00:00.000Z_2015-04-03T02:36:45.426Z" : 5
    },
    "events" : [ {
      "segmentId" : "pageviews_2015-03-24T00:00:00.000Z_2015-03-25T00:00:00.000Z_2015-04-03T02:36:45.426Z",
      "offset" : 0,
      "event" : {
        "timestamp" : "2015-03-24T14:00:00.000Z",
        "url" : "http://site.com/1",
        "count" : 3.0
      }
    }, {
      "segmentId" : "pageviews_2015-03-24T00:00:00.000Z_2015-03-25T00:00:00.000Z_2015-04-03T02:36:45.426Z",
      "offset" : 1,
      "event" : {
        "timestamp" : "2015-03-24T14:00:00.000Z",
        "url" : "http://site.com/2",
        "count" : 2.0
      }
    }, {
      "segmentId" : "pageviews_2015-03-24T00:00:00.000Z_2015-03-25T00:00:00.000Z_2015-04-03T02:36:45.426Z",
      "offset" : 2,
      "event" : {
        "timestamp" : "2015-03-24T14:00:00.000Z",
        "url" : "http://site.com/3",
        "count" : 1.0
      }
    }, {
      "segmentId" : "pageviews_2015-03-24T00:00:00.000Z_2015-03-25T00:00:00.000Z_2015-04-03T02:36:45.426Z",
      "offset" : 3,
      "event" : {
        "timestamp" : "2015-03-24T15:00:00.000Z",
        "url" : "http://site.com/1",
        "count" : 2.0
      }
    }, {
      "segmentId" : "pageviews_2015-03-24T00:00:00.000Z_2015-03-25T00:00:00.000Z_2015-04-03T02:36:45.426Z",
      "offset" : 4,
      "event" : {
        "timestamp" : "2015-03-24T15:00:00.000Z",
        "url" : "http://site.com/2",
        "count" : 2.0
      }
    }, {
      "segmentId" : "pageviews_2015-03-24T00:00:00.000Z_2015-03-25T00:00:00.000Z_2015-04-03T02:36:45.426Z",
      "offset" : 5,
      "event" : {
        "timestamp" : "2015-03-24T16:00:00.000Z",
        "url" : "http://site.com/1",
        "count" : 2.0
      }
    } ]
  }
} ]
Or to look at this visually:
To get the number of pageviews for a specific url, we use a timeseries query with a filter on the url dimension:
{
  "queryType": "timeseries",
  "dataSource": "pageviews",
  "intervals": [
    "2015-03-01/2015-04-01"
  ],
  "granularity": "hour",
  "filter": {
    "type": "selector",
    "dimension": "url",
    "value": "http://site.com/1"
  },
  "aggregations": [
    {
      "type": "longSum",
      "fieldName": "count",
      "name": "pageviews"
    }
  ]
}
This query returns:
[ {
  "timestamp" : "2015-03-24T14:00:00.000Z",
  "result" : {
    "pageviews" : 3
  }
}, {
  "timestamp" : "2015-03-24T15:00:00.000Z",
  "result" : {
    "pageviews" : 2
  }
}, {
  "timestamp" : "2015-03-24T16:00:00.000Z",
  "result" : {
    "pageviews" : 2
  }
} ]
If you look back at the results of the last select query, you can see that Druid already has the pageview count for each hour and url, so it can just find the rows for the url http://site.com/1 and return those counts.
Or if we want the number of pageviews for each url, we can use a groupBy query on the url dimension (pageviews-by-url.json):
{
  "queryType": "groupBy",
  "dataSource": "pageviews",
  "intervals": [
    "2015-03-01/2015-04-01"
  ],
  "granularity": "hour",
  "dimensions": [
    "url"
  ],
  "aggregations": [
    {
      "type": "longSum",
      "fieldName": "count",
      "name": "pageviews"
    }
  ]
}
This query returns:
[ {
  "version" : "v1",
  "timestamp" : "2015-03-24T14:00:00.000Z",
  "event" : {
    "pageviews" : 3,
    "url" : "http://site.com/1"
  }
}, {
  "version" : "v1",
  "timestamp" : "2015-03-24T14:00:00.000Z",
  "event" : {
    "pageviews" : 2,
    "url" : "http://site.com/2"
  }
}, {
  "version" : "v1",
  "timestamp" : "2015-03-24T14:00:00.000Z",
  "event" : {
    "pageviews" : 1,
    "url" : "http://site.com/3"
  }
}, {
  "version" : "v1",
  "timestamp" : "2015-03-24T15:00:00.000Z",
  "event" : {
    "pageviews" : 2,
    "url" : "http://site.com/1"
  }
}, {
  "version" : "v1",
  "timestamp" : "2015-03-24T15:00:00.000Z",
  "event" : {
    "pageviews" : 2,
    "url" : "http://site.com/2"
  }
}, {
  "version" : "v1",
  "timestamp" : "2015-03-24T16:00:00.000Z",
  "event" : {
    "pageviews" : 2,
    "url" : "http://site.com/1"
  }
} ]
Again, Druid already has the pageview count for each hour and url in its rows, so this is an easy question to answer.
And of course, we can still use the same timeseries query as before (without any filters) to get the total number of pageviews across all urls, and this query returns the same results as when we didn’t include url as a dimension during indexing:
[ {
  "timestamp" : "2015-03-24T14:00:00.000Z",
  "result" : {
    "pageviews" : 6
  }
}, {
  "timestamp" : "2015-03-24T15:00:00.000Z",
  "result" : {
    "pageviews" : 4
  }
}, {
  "timestamp" : "2015-03-24T16:00:00.000Z",
  "result" : {
    "pageviews" : 2
  }
} ]
Druid doesn’t actually contain these exact values in its rows. Now we’re making Druid do some work! To answer this query, Druid needs to sum the count field of all rows within the same hour.
This demonstrates a tradeoff with Druid: the more dimensions we use to divide up the underlying events that are aggregated together and stored in rows, the more detail we can drill-down to in our queries, but the more potential work Druid may need to do at query time to answer the queries. At one end of the spectrum, Druid does no aggregation at indexing time and all of the aggregation at query time. At the other end of the spectrum, Druid does all of the aggregation at indexing time and doesn’t need to do any aggregation at query time. Where you should be on the spectrum really depends on the queries you need Druid to support.
This is why it’s important to analyze exactly what Druid will store in its segments, and think through how this data will be used to answer the queries you want to ask. As an example, if we included eventId as a dimension but never needed to filter or group by eventId in any queries, Druid would needlessly store each event in its own row (since each event has its own unique eventId) and then potentially have a lot of rows to aggregate together at query time, since it couldn’t do any of the aggregating at index time.
Continuing on, now let’s suppose that executive wants another chart showing the number of unique visitors within each hour. Now we want to know the number of unique users that visited the site, not the number of pageviews. The two ways we’ve had Druid index our pageview events cannot answer this query. So we need to re-index the data.
One possible approach is to use userId as a dimension (although we’ll later see that this may not be the best approach):
          "dimensionsSpec": {
            "dimensions": [
              "userId"
            ],
            "dimensionExclusions": [
              "eventId",
              "url"
            ],
            "spatialDimensions": []
          }
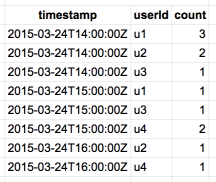
After re-indexing the data, let’s use the select query to see what Druid stored in its segment:
[ {
  "timestamp" : "2015-03-24T14:00:00.000Z",
  "result" : {
    "pagingIdentifiers" : {
      "pageviews_2015-03-24T00:00:00.000Z_2015-03-25T00:00:00.000Z_2015-04-04T23:26:42.205Z" : 7
    },
    "events" : [ {
      "segmentId" : "pageviews_2015-03-24T00:00:00.000Z_2015-03-25T00:00:00.000Z_2015-04-04T23:26:42.205Z",
      "offset" : 0,
      "event" : {
        "timestamp" : "2015-03-24T14:00:00.000Z",
        "userId" : "u1",
        "count" : 3.0
      }
    }, {
      "segmentId" : "pageviews_2015-03-24T00:00:00.000Z_2015-03-25T00:00:00.000Z_2015-04-04T23:26:42.205Z",
      "offset" : 1,
      "event" : {
        "timestamp" : "2015-03-24T14:00:00.000Z",
        "userId" : "u2",
        "count" : 2.0
      }
    }, {
      "segmentId" : "pageviews_2015-03-24T00:00:00.000Z_2015-03-25T00:00:00.000Z_2015-04-04T23:26:42.205Z",
      "offset" : 2,
      "event" : {
        "timestamp" : "2015-03-24T14:00:00.000Z",
        "userId" : "u3",
        "count" : 1.0
      }
    }, {
      "segmentId" : "pageviews_2015-03-24T00:00:00.000Z_2015-03-25T00:00:00.000Z_2015-04-04T23:26:42.205Z",
      "offset" : 3,
      "event" : {
        "timestamp" : "2015-03-24T15:00:00.000Z",
        "userId" : "u1",
        "count" : 1.0
      }
    }, {
      "segmentId" : "pageviews_2015-03-24T00:00:00.000Z_2015-03-25T00:00:00.000Z_2015-04-04T23:26:42.205Z",
      "offset" : 4,
      "event" : {
        "timestamp" : "2015-03-24T15:00:00.000Z",
        "userId" : "u3",
        "count" : 1.0
      }
    }, {
      "segmentId" : "pageviews_2015-03-24T00:00:00.000Z_2015-03-25T00:00:00.000Z_2015-04-04T23:26:42.205Z",
      "offset" : 5,
      "event" : {
        "timestamp" : "2015-03-24T15:00:00.000Z",
        "userId" : "u4",
        "count" : 2.0
      }
    }, {
      "segmentId" : "pageviews_2015-03-24T00:00:00.000Z_2015-03-25T00:00:00.000Z_2015-04-04T23:26:42.205Z",
      "offset" : 6,
      "event" : {
        "timestamp" : "2015-03-24T16:00:00.000Z",
        "userId" : "u2",
        "count" : 1.0
      }
    }, {
      "segmentId" : "pageviews_2015-03-24T00:00:00.000Z_2015-03-25T00:00:00.000Z_2015-04-04T23:26:42.205Z",
      "offset" : 7,
      "event" : {
        "timestamp" : "2015-03-24T16:00:00.000Z",
        "userId" : "u4",
        "count" : 1.0
      }
    } ]
  }
} ]
Within each hour period, Druid has created one row for each userId and has counted the number of pageviews for that user during that hour.
To get the number of unique visitors (i.e. users) with pageviews in each hour, we use a timeseries query with a cardinality aggregation on the userId dimension:
{
  "queryType": "timeseries",
  "dataSource": "pageviews",
  "intervals": [
    "2015-03-01/2015-04-01"
  ],
  "granularity": "hour",
  "aggregations": [
    {
      "type": "cardinality",
      "fieldNames": [
        "userId"
      ],
      "name": "uniqueVisitors"
    }
  ]
}
This query returns:
[ {
  "timestamp" : "2015-03-24T14:00:00.000Z",
  "result" : {
    "uniqueVisitors" : 3.0021994137521975
  }
}, {
  "timestamp" : "2015-03-24T15:00:00.000Z",
  "result" : {
    "uniqueVisitors" : 3.0021994137521975
  }
}, {
  "timestamp" : "2015-03-24T16:00:00.000Z",
  "result" : {
    "uniqueVisitors" : 2.000977198748901
  }
} ]
What’s up with the non-integer visitor counts? How can we have a fraction of a visitor? Druid’s cardinality aggregation uses HyperLogLog to count the number of unique values of a dimension. The details of HLL are beyond the scope of this blog post, but briefly, HLL is a very efficient way to add elements to a set and then estimate the size of that set. In this case, we’re estimating the number of unique userIds with pageviews in each hour period.
For our purposes, we can just round these unique visitor counts to the nearest integer. Even though they are estimates, after rounding we get the correct number of unique visitors.
Note that if we were to query for unique visitors very often, we’d be making Druid perform the same HLL aggregations many times. To avoid this, we can actually have Druid compute the HLLs at indexing time instead of querying time. To achieve this, instead of specifying userId as a dimension, we use a hyperUnique aggregation on the userId field:
      "metricsSpec": [
        {
          "type": "count",
          "name": "count"
        },
        {
          "type": "hyperUnique",
          "fieldName": "userId",
          "name": "userIdHll"
        }
      ],
Results from the select query after re-indexing the data using this new spec:
[ {
  "timestamp" : "2015-03-24T14:00:00.000Z",
  "result" : {
    "pagingIdentifiers" : {
      "pageviews_2015-03-24T00:00:00.000Z_2015-03-25T00:00:00.000Z_2015-04-05T02:23:00.385Z" : 2
    },
    "events" : [ {
      "segmentId" : "pageviews_2015-03-24T00:00:00.000Z_2015-03-25T00:00:00.000Z_2015-04-05T02:23:00.385Z",
      "offset" : 0,
      "event" : {
        "timestamp" : "2015-03-24T14:00:00.000Z",
        "userIdHll" : "AQAAAwAAAAApAwB+IAMaEA==",
        "count" : 6.0
      }
    }, {
      "segmentId" : "pageviews_2015-03-24T00:00:00.000Z_2015-03-25T00:00:00.000Z_2015-04-05T02:23:00.385Z",
      "offset" : 1,
      "event" : {
        "timestamp" : "2015-03-24T15:00:00.000Z",
        "userIdHll" : "AQAAAwAAAAApAwLhAQMaEA==",
        "count" : 4.0
      }
    }, {
      "segmentId" : "pageviews_2015-03-24T00:00:00.000Z_2015-03-25T00:00:00.000Z_2015-04-05T02:23:00.385Z",
      "offset" : 2,
      "event" : {
        "timestamp" : "2015-03-24T16:00:00.000Z",
        "userIdHll" : "AQAAAgAAAAB+IALhAQ==",
        "count" : 2.0
      }
    } ]
  }
} ]
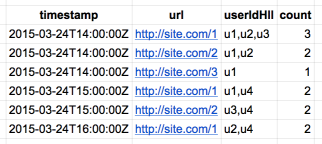
We no longer see a separate row for each userId; instead we see one row for each hour, with both a userIdHll and a pageview count. The userIdHll field contains exactly what we wanted: a pre-computed HLL containing all unique userIds with pageviews during that hour.
To get the number of unique visitors with pageviews during each hour, we use a hyperUnique aggregation in the timeseries query, instead of a cardinality aggregation:
{
  "queryType": "timeseries",
  "dataSource": "pageviews",
  "intervals": [
    "2015-03-01/2015-04-01"
  ],
  "granularity": "hour",
  "aggregations": [
    {
      "type": "hyperUnique",
      "fieldName": "userIdHll",
      "name": "uniqueVisitors"
    }
  ]
}
This query returns:
[ {
  "timestamp" : "2015-03-24T14:00:00.000Z",
  "result" : {
    "uniqueVisitors" : 3.0021994137521975
  }
}, {
  "timestamp" : "2015-03-24T15:00:00.000Z",
  "result" : {
    "uniqueVisitors" : 3.0021994137521975
  }
}, {
  "timestamp" : "2015-03-24T16:00:00.000Z",
  "result" : {
    "uniqueVisitors" : 2.000977198748901
  }
} ]
We get the same results as when we indexed with userId as a dimension and queried with a cardinality aggregation on userId. Except now we have far fewer rows to store in the segment (less disk usage), and the HLLs were all pre-computed (faster queries). In general, if you need to query often for the unique number of something, I think it’s better to use a hyperUnique aggregation during indexing and querying than it is to use a dimension during indexing and a cardinality aggregation during querying.
As a final example, suppose we need to be able to determine the number of unique visitors for each url separately. Currently our data in Druid won’t support that kind of query; we need to include url as a dimension (and keep the hyperUnique aggregation on userId):
          "dimensionsSpec": {
            "dimensions": [
              "url"
            ],
            "dimensionExclusions": [
              "eventId",
              "userId"
            ],
            "spatialDimensions": []
          }
        }
      },
      "metricsSpec": [
        {
          "type": "count",
          "name": "count"
        },
        {
          "type": "hyperUnique",
          "fieldName": "userId",
          "name": "userIdHll"
        }
      ],
After indexing again, the select query returns:
[ {
  "timestamp" : "2015-03-24T14:00:00.000Z",
  "result" : {
    "pagingIdentifiers" : {
      "pageviews_2015-03-24T00:00:00.000Z_2015-03-25T00:00:00.000Z_2015-04-05T02:46:37.650Z" : 5
    },
    "events" : [ {
      "segmentId" : "pageviews_2015-03-24T00:00:00.000Z_2015-03-25T00:00:00.000Z_2015-04-05T02:46:37.650Z",
      "offset" : 0,
      "event" : {
        "timestamp" : "2015-03-24T14:00:00.000Z",
        "url" : "http://site.com/1",
        "userIdHll" : "AQAAAwAAAAApAwB+IAMaEA==",
        "count" : 3.0
      }
    }, {
      "segmentId" : "pageviews_2015-03-24T00:00:00.000Z_2015-03-25T00:00:00.000Z_2015-04-05T02:46:37.650Z",
      "offset" : 1,
      "event" : {
        "timestamp" : "2015-03-24T14:00:00.000Z",
        "url" : "http://site.com/2",
        "userIdHll" : "AQAAAgAAAAB+IAMaEA==",
        "count" : 2.0
      }
    }, {
      "segmentId" : "pageviews_2015-03-24T00:00:00.000Z_2015-03-25T00:00:00.000Z_2015-04-05T02:46:37.650Z",
      "offset" : 2,
      "event" : {
        "timestamp" : "2015-03-24T14:00:00.000Z",
        "url" : "http://site.com/3",
        "userIdHll" : "AQAAAQAAAAMaEA==",
        "count" : 1.0
      }
    }, {
      "segmentId" : "pageviews_2015-03-24T00:00:00.000Z_2015-03-25T00:00:00.000Z_2015-04-05T02:46:37.650Z",
      "offset" : 3,
      "event" : {
        "timestamp" : "2015-03-24T15:00:00.000Z",
        "url" : "http://site.com/1",
        "userIdHll" : "AQAAAgAAAALhAQMaEA==",
        "count" : 2.0
      }
    }, {
      "segmentId" : "pageviews_2015-03-24T00:00:00.000Z_2015-03-25T00:00:00.000Z_2015-04-05T02:46:37.650Z",
      "offset" : 4,
      "event" : {
        "timestamp" : "2015-03-24T15:00:00.000Z",
        "url" : "http://site.com/2",
        "userIdHll" : "AQAAAgAAAAApAwLhAQ==",
        "count" : 2.0
      }
    }, {
      "segmentId" : "pageviews_2015-03-24T00:00:00.000Z_2015-03-25T00:00:00.000Z_2015-04-05T02:46:37.650Z",
      "offset" : 5,
      "event" : {
        "timestamp" : "2015-03-24T16:00:00.000Z",
        "url" : "http://site.com/1",
        "userIdHll" : "AQAAAgAAAAB+IALhAQ==",
        "count" : 2.0
      }
    } ]
  }
} ]
As expected, we see a separate row for each url in each hour, along with the HLL for all userIds that viewed that url in that hour and the total count of all pageviews for that url in that hour.
To get the number of unique visitors within each hour for a specific url, we use a timeseries query with a filter on url and a hyperUnique aggregation on userIdHll:
{
  "queryType": "timeseries",
  "dataSource": "pageviews",
  "intervals": [
    "2015-03-01/2015-04-01"
  ],
  "granularity": "hour",
  "filter": {
    "type": "selector",
    "dimension": "url",
    "value": "http://site.com/1"
  },
  "aggregations": [
    {
      "type": "hyperUnique",
      "fieldName": "userIdHll",
      "name": "uniqueVisitors"
    }
  ]
}
This query returns:
[ {
  "timestamp" : "2015-03-24T14:00:00.000Z",
  "result" : {
    "uniqueVisitors" : 3.0021994137521975
  }
}, {
  "timestamp" : "2015-03-24T15:00:00.000Z",
  "result" : {
    "uniqueVisitors" : 2.000977198748901
  }
}, {
  "timestamp" : "2015-03-24T16:00:00.000Z",
  "result" : {
    "uniqueVisitors" : 2.000977198748901
  }
} ]
Or, to get the number of unique visitors that viewed each url within each hour, we can use a groupBy query on the url dimension:
{
  "queryType": "groupBy",
  "dataSource": "pageviews",
  "intervals": [
    "2015-03-01/2015-04-01"
  ],
  "granularity": "hour",
  "dimensions": [
    "url"
  ],
  "aggregations": [
    {
      "type": "hyperUnique",
      "fieldName": "userIdHll",
      "name": "uniqueVisitors"
    }
  ]
}
This query returns:
[ {
  "version" : "v1",
  "timestamp" : "2015-03-24T14:00:00.000Z",
  "event" : {
    "uniqueVisitors" : 3.0021994137521975,
    "url" : "http://site.com/1"
  }
}, {
  "version" : "v1",
  "timestamp" : "2015-03-24T14:00:00.000Z",
  "event" : {
    "uniqueVisitors" : 2.000977198748901,
    "url" : "http://site.com/2"
  }
}, {
  "version" : "v1",
  "timestamp" : "2015-03-24T14:00:00.000Z",
  "event" : {
    "uniqueVisitors" : 1.0002442201269182,
    "url" : "http://site.com/3"
  }
}, {
  "version" : "v1",
  "timestamp" : "2015-03-24T15:00:00.000Z",
  "event" : {
    "uniqueVisitors" : 2.000977198748901,
    "url" : "http://site.com/1"
  }
}, {
  "version" : "v1",
  "timestamp" : "2015-03-24T15:00:00.000Z",
  "event" : {
    "uniqueVisitors" : 2.000977198748901,
    "url" : "http://site.com/2"
  }
}, {
  "version" : "v1",
  "timestamp" : "2015-03-24T16:00:00.000Z",
  "event" : {
    "uniqueVisitors" : 2.000977198748901,
    "url" : "http://site.com/1"
  }
} ]
And of course, we can still use the same timeseries query as before with a hyperUnique aggregation on userIdHll to get the total number of unique visitors within each hour (across all urls). This query returns the expected results:
[ {
  "timestamp" : "2015-03-24T14:00:00.000Z",
  "result" : {
    "uniqueVisitors" : 3.0021994137521975
  }
}, {
  "timestamp" : "2015-03-24T15:00:00.000Z",
  "result" : {
    "uniqueVisitors" : 3.0021994137521975
  }
}, {
  "timestamp" : "2015-03-24T16:00:00.000Z",
  "result" : {
    "uniqueVisitors" : 2.000977198748901
  }
} ]
To compute these results, at query time Druid must merge the HLLs for all urls with the same hour to get the total number of unique visitors.
Also note that in each row, Druid is still storing the pageview counts. This means that we can still obtain the total pageviews per hour just like we did previously:
[ {
  "timestamp" : "2015-03-24T14:00:00.000Z",
  "result" : {
    "pageviews" : 6
  }
}, {
  "timestamp" : "2015-03-24T15:00:00.000Z",
  "result" : {
    "pageviews" : 4
  }
}, {
  "timestamp" : "2015-03-24T16:00:00.000Z",
  "result" : {
    "pageviews" : 2
  }
} ]
Or even obtain the pageviews per hour for each url just like we did previously:
[ {
  "version" : "v1",
  "timestamp" : "2015-03-24T14:00:00.000Z",
  "event" : {
    "pageviews" : 3,
    "url" : "http://site.com/1"
  }
}, {
  "version" : "v1",
  "timestamp" : "2015-03-24T14:00:00.000Z",
  "event" : {
    "pageviews" : 2,
    "url" : "http://site.com/2"
  }
}, {
  "version" : "v1",
  "timestamp" : "2015-03-24T14:00:00.000Z",
  "event" : {
    "pageviews" : 1,
    "url" : "http://site.com/3"
  }
}, {
  "version" : "v1",
  "timestamp" : "2015-03-24T15:00:00.000Z",
  "event" : {
    "pageviews" : 2,
    "url" : "http://site.com/1"
  }
}, {
  "version" : "v1",
  "timestamp" : "2015-03-24T15:00:00.000Z",
  "event" : {
    "pageviews" : 2,
    "url" : "http://site.com/2"
  }
}, {
  "version" : "v1",
  "timestamp" : "2015-03-24T16:00:00.000Z",
  "event" : {
    "pageviews" : 2,
    "url" : "http://site.com/1"
  }
} ]
So that’s it! Kudos to you if you actually read this entire lengthy blog post. We’ve now seen how various choices of dimensions and aggregations during indexing lead to Druid pre-computing different values in the rows and storing them in segments, and how these choices affect the different questions we can answer, how to write the actual queries and what the trade-offs are between high drill-down capability and high space and time costs. Thinking through all of these things has definitely helped me understand Druid and use it more effectively, and I hope that this information helps you too.





The blog is very nicely written and explains the concepts very clearly, I had lot of issues executing unique queries on druid, there were no detailed docs on the website. After found your blog, all the queries were piece of cake. Thanks for spending time to write this detailed blog, it was super helpful.
Very well-written and useful!!
Hi thanks Zach for this article, giving me additional insight about Druid.
Thanks for such a nice article,while trying the example on my local druid cluster, i am getting java.lang.IllegalArgumentException: Invalid max row count: 0
at io.druid.segment.incremental.IncrementalIndex$Builder.buildOnheap(IncrementalIndex.java:377) ~[druid-processing-0.11.0.jar:0.11.0]
at io.druid.segment.realtime.plumber.Sink.makeNewCurrIndex(Sink.java:267) ~[druid-server-0.11.0.jar:0.11.0]
at io.druid.segment.realtime.plumber.Sink.(Sink.java:88) ~[druid-server-0.11.0.jar:0.11.0]
at io.druid.segment.realtime.appenderator.AppenderatorImpl.getOrCreateSink(AppenderatorImpl.java:278) ~[druid-server-0.11.0.jar:0.11.0]
at io.druid.segment.realtime.appenderator.AppenderatorImpl.add(AppenderatorImpl.java:203) ~[druid-server-0.11.0.jar:0.11.0]
at io.druid.segment.realtime.appenderator.AppenderatorDriver.add(AppenderatorDriver.java:233) ~[druid-server-0.11.0.jar:0.11.0]
at io.druid.indexing.common.task.IndexTask.generateAndPublishSegments(IndexTask.java:656) ~[druid-indexing-service-0.11.0.jar:0.11.0]
at io.druid.indexing.common.task.IndexTask.run(IndexTask.java:233) ~[druid-indexing-service-0.11.0.jar:0.11.0]
at io.druid.indexing.overlord.ThreadPoolTaskRunner$ThreadPoolTaskRunnerCallable.call(ThreadPoolTaskRunner.java:436) [druid-indexing-service-0.11.0.jar:0.11.0]
at io.druid.indexing.overlord.ThreadPoolTaskRunner$ThreadPoolTaskRunnerCallable.call(ThreadPoolTaskRunner.java:408) [druid-indexing-service-0.11.0.jar:0.11.0]
at java.util.concurrent.FutureTask.run(FutureTask.java:266) [?:1.8.0_162]
at java.util.concurrent.ThreadPoolExecutor.runWorker(ThreadPoolExecutor.java:1149) [?:1.8.0_162]
at java.util.concurrent.ThreadPoolExecutor$Worker.run(ThreadPoolExecutor.java:624) [?:1.8.0_162]
at java.lang.Thread.run(Thread.java:748) [?:1.8.0_162]
2018-03-13T07:52:44,931 INFO [task-runner-0-priority-0] io.druid.indexing.overlord.TaskRunnerUtils – Task [index_pageviews_2018-03-13T07:52:14.745Z] status changed to [FAILED].
2018-03-13T07:52:44,942 INFO [task-runner-0-priority-0] io.druid.indexing.worker.executor.ExecutorLifecycle – Task completed with status: {
“id” : “index_pageviews_2018-03-13T07:52:14.745Z”,
“status” : “FAILED”,
“duration” : 336
}
Please help
Did you ever find an answer to your java.lang.IllegalArgumentException: Invalid max row count: 0
problem?
great write up with details, helped a lot to understand things and do hands-on with druid.
Pingback: Loading Json data from batch file into Druid | Clean Programmer
Pingback: Getting Unique Counts from Druid Using HyperLogLog - Clean Programmer
Pingback: Getting Unique Counts from Druid Using HyperLogLog - Monzurul Haque Shimul
Pingback: Loading Json Data From Batch File Into Druid